Terminal Velocity Lab
Purpose
To determine the affect of velocity on air resistance for a falling balloon.
Equipment
- TI-84 instruments
-vernier motion sensor
-balloon
-weights
-scale
-tape
Procedure
1. Inflate balloon, weight mass.
2. Drop balloon from 4 cm away from motion sensor.
3. Import data to laptop into logger pro.
4. Do best fit line on straightest part of the slope of the graph.
5. Add one washer per trial and reweigh.
6. Repeat steps 1-5 until 5 trials are completed.
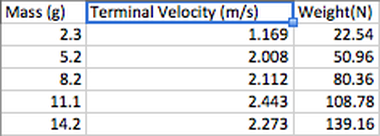
Data
To determine the affect of velocity on air resistance for a falling balloon.
Equipment
- TI-84 instruments
-vernier motion sensor
-balloon
-weights
-scale
-tape
Procedure
1. Inflate balloon, weight mass.
2. Drop balloon from 4 cm away from motion sensor.
3. Import data to laptop into logger pro.
4. Do best fit line on straightest part of the slope of the graph.
5. Add one washer per trial and reweigh.
6. Repeat steps 1-5 until 5 trials are completed.
Data
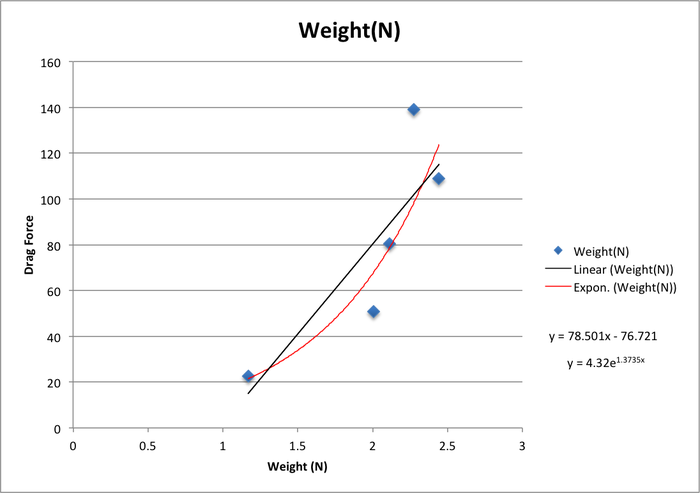
Conclusion
After analyzing my data and using excel to graph a weight versus terminal velocity graph it appears that the data has little correlation that can prove a direct relationship between drag force and the velocity of an object. Even after attempting to place a line of best fit there still seems to be no strong correlation between the data. After also realizing that the linear line of best fit has a extremely low y-intercept value it can be concluded that there was some fatal error in our experimentation. Due to the fact that it is highly likely there is a measurable correlation between air resistance and velocity out data seems to be corrupt. The most likely sources of error include the transfer of data between devices, the way the balloon was dropped under the motion sensor, and by having too few trials.
