Purpose
1. Observe motion via video analysis.
2. Collect position vs. time data.
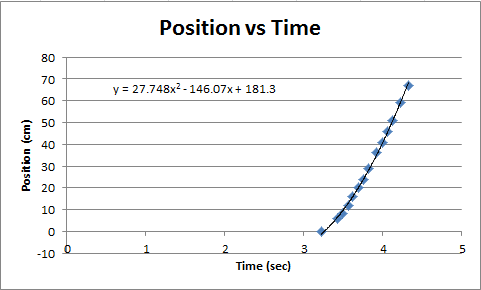
3. Plot position vs. time and add best fit line.
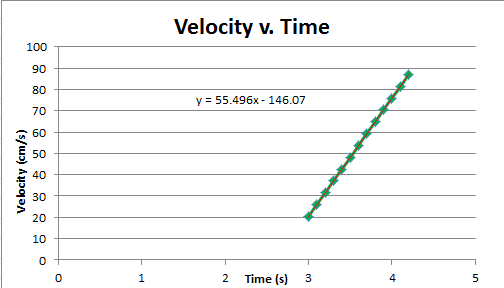
4. Derive velocity fuction from best fit equation.
2. Collect position vs. time data.
3. Plot position vs. time and add best fit line.
4. Derive velocity fuction from best fit equation.
Equipment
-Toy Car
-Video Camera
-cardboard background meter stick
-Windows movie maker
-Video Camera
-cardboard background meter stick
-Windows movie maker
Procedure
1. Stand the cardboard background ruler up vertically so that it is easily visible on the camcarder.
2. Start recording with the camcorder and then start the toy car.
3 Record data and then create a position v. time graph. Using microsoft excel find a quadratic line of best fit.
4. Derive the velocity v. time formula from the position v. time formula.
2. Start recording with the camcorder and then start the toy car.
3 Record data and then create a position v. time graph. Using microsoft excel find a quadratic line of best fit.
4. Derive the velocity v. time formula from the position v. time formula.
Data & Analysis
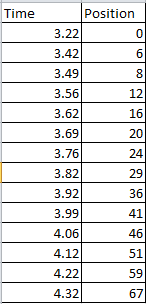
This data has a quadratic trend which represents a increase in velocity over time! When the derivitive of the formula for the line of best fit is taken another equation which represents the car's velocity v. time is found. The linear nature of the velocity v. time graph shows how the car has a constant acceleration over time.
Conclusion
Through this lab I have increased my understanding of how to use microsoft excel to create lines of best fit for data points. I also used video editing software to observe and record position v. time data for my toy car. By applying what I was taught in class I was able to derive the velocity v. time equation from the position v. time equation and show that the toy car had a constant increase in velocity from its start. Overall this lab helped me to better understand the subject matter of derivitives and how to record and report data effectively.
